
 20 April 2023
Close
 31 July 2020
 4 MIN READ
  BY
Rahul
BY
RahulEver wondered, about your application’s responsiveness and stability under various workload? Performance Testing enhances both for a better user experience.
Well, to ensure that it meets the expected service levels in production, as well as deliver a positive user experience. Application performance is a key determinant of adoption, success, and productivity.
Performance testing is a method performed to determine the responsiveness and attitude of a system when a particular workload is applied on it. It can also give us the information about how the system performs in variable workloads in terms of average throughput, average response time, user hits per second etc.
Performance testing can be done using jmeter and also by BlazeMeter. A BlazeMeter report based on a jmeter script somehow gives us the detailed report of how the system worked in the applied load under a fixed stress point.
These reports give us the exact count of errors for each action, the behaviour of errors, and the response code returned for each of these errors.
BlazeMeter also provides various graphs related to the parameters like load time graph, engine health graph, response time graph, request status graphs etc. which will give us a quick understanding of how the system performs in response to each request of our web/mobile application.
The user load graph illustrates the response of the system at different stages of the user hits, that is, the percentage of error occurred during each second when the entire user load hits the system simultaneously.
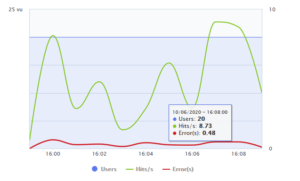
The load graph above clearly depicts the performance of the system for an applied user load. All the indicators of the graph is marked as horizontal curves.

Clicking on any point will display the maximum users, user hits/second and error rate at the point.
For an ideal system, the error rate stays at 0% which turns the graph to vanish out the red error curve in the system even when the user hits per second increases up to the maximum users.
A Response time graph indicates the rate of responses against the user hits. The response time graph shows how the applied user load affects the responses.
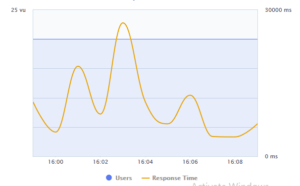
The graph shows only one curve which indicates the response time for each second.
In the above graph, when it reaches the maximum applied users, the response time also increases to the maximum which indicates the low performance of the application.
For a good performing system, the response time is uniform for every second and does not vary.
The response time curve will be straight and response time will be low for an ideal application.

On clicking at any point on the curve, the response time for the maximum users at that particular second is displayed.

A timeline graph depicts various parameters in a single graph. The parameters depicted in the graph are as follows:

The key performance indicators shows the status of various parameters when the application worked on the applied load.
There are 4 different curves which indicates each of the key performance indicators:
On the left side of the timeline graph, shows the API’s with error count for each, response time, latency time, bytes per second and the response code received for each of the requests.

Clicking on each of the options, it will highlight the respective request curve with all of its key performance indicators.
An engine health graph shows the capacity of the user engine used for testing.
It also helps us understand whether the testing infrastructure is the reason for obtaining bottlenecks or errors.
Performance testing gathers all the tests that verify an application’s speed, robustness, reliability, and correct sizing. It examines several indicators such as a browser, page and network response times, server query processing time, number of acceptable concurrent users architected, CPU memory consumption, and number/type of errors which may be encountered when using an application.