
 27 August 2024

Application Performance Audit Guide for CTOs and Founders
2 June 2026
 8:33 MIN Read time
  BY
Amju
BY
Amju
Most applications don’t fail overnight. They slow down gradually, drop users quietly, and burn engineering hours on problems that never get properly diagnosed. A structured application performance audit guide changes that. Rather than reacting to complaints or trusting gut instincts, you work through a repeatable, evidence-based process that surfaces real bottlenecks, validates fixes, and proves results with data. This guide walks you through exactly how to do that, from prep work to post-audit documentation, in a way that fits how real technical teams actually operate.
Table of Contents
- Key takeaways
- Setting up your application performance audit
- Identifying and prioritizing performance bottlenecks
- Validating hypotheses with production-safe tests
- Documenting results and setting up ongoing monitoring
- My honest take on what actually works
- How Testvox can support your performance audit
- FAQ
Key takeaways
| Point | Details |
|---|---|
| Set targets before you audit | Define SLIs and SLOs with latency percentiles before starting, so you have a measurable baseline to work against. |
| Use tail percentiles, not averages | P95 and P99 latency reveals the worst-case experience your real users are actually having. |
| Validate before you fix | Reproduce the slow behavior and confirm root cause before writing a single line of optimization code. |
| Test in production safely | Canary deployments with OpenTelemetry let you compare old and new versions side by side without risking your entire user base. |
| Document and automate learnings | Build regression checks into your CI/CD pipeline so performance regressions never quietly ship again. |
Setting up your application performance audit
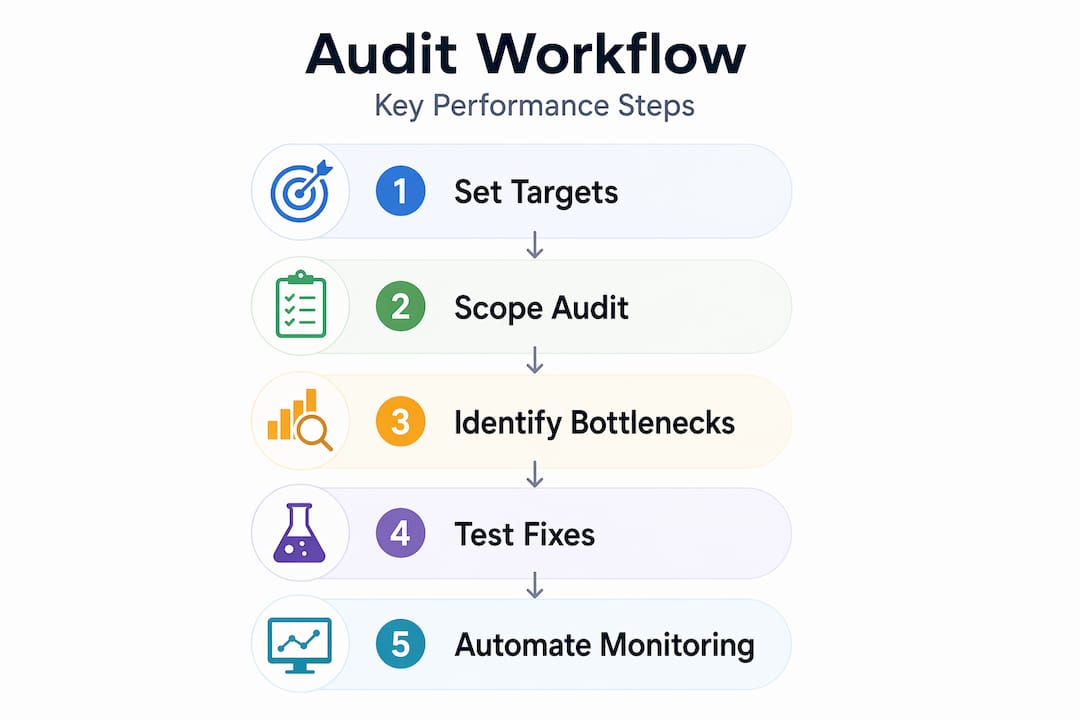
Before you touch a profiler or run a single load test, you need a clear picture of what you’re measuring and why. Structured audit methodologies consistently outperform surface-level monitoring by following a defined workflow: capture baselines, analyze critical paths, identify bottlenecks, and validate fixes. Without this scaffolding, you end up with a pile of data and no actionable direction.
Define your performance targets first
Start by establishing Service Level Indicators (SLIs) and Service Level Objectives (SLOs). An SLI is a specific metric, like the percentage of requests completing under 300ms. An SLO is your target for that metric, like 99% of requests completing under 300ms over a 30-day window. Linking SLOs to error budgets is what turns abstract performance goals into real engineering decisions. If your error budget is 20% burned and you’re mid-sprint, you know to prioritize reliability over new features.
Here’s a quick reference table to get your audit infrastructure in place:
| Category | Tool or metric | Target example |
|---|---|---|
| Latency monitoring | OpenTelemetry, Prometheus | P95 < 300ms, P99 < 800ms |
| Error rate | Application logs, APM platform | < 0.5% error rate per endpoint |
| Throughput | Load testing tools | Stable at expected peak RPS |
| Front-end speed | Core Web Vitals (CLS, INP) | INP < 200ms, CLS < 0.1 |
| Infrastructure | CPU, memory, disk I/O metrics | CPU < 70% under normal load |
The scope of your audit matters just as much as the tools. Don’t attempt to audit everything at once. Pick the workflows that carry the most user or revenue impact. A checkout flow on an e-commerce platform matters more than a rarely visited admin dashboard. Front-end Core Web Vitals like INP and CLS belong in scope for any user-facing application, but they require different tooling and expertise than backend latency analysis.
Pro Tip: Start your audit scoping by pulling your five highest-traffic endpoints from your existing monitoring. These are almost always where the most impactful bottlenecks live, and they give you quick wins that build internal credibility for the audit process.
Identifying and prioritizing performance bottlenecks
With your targets and tools in place, the next step is finding where your application actually breaks down. This is where most teams make their first major mistake: they look at average response times. Averages are misleading. Tail latency using P95/P99 reflects real worst-case user experiences, and ignoring it produces false optimism. If your P50 is 80ms but your P99 is 4 seconds, roughly 1 in 100 requests is delivering a terrible experience, and averages will never show you that.

The methodology here is to trace request flows end to end. You’re looking for “hot paths,” the sequences of code and infrastructure that run on every request and accumulate the most latency. Distributed tracing tools let you see exactly where time is being spent across services, databases, queues, and external APIs.
Ranking bottlenecks by impact and fixability is what separates efficient audits from long, expensive ones. Not every bottleneck is worth fixing immediately. Some have enormous impact but require an architectural overhaul. Others are tiny to fix and yield meaningful gains. You want to identify and prioritize the ones that fall in the high-impact, low-effort quadrant first.
Common bottleneck categories to investigate during your audit application efficiency process:
- CPU-bound issues: Tight loops, synchronous computation in request paths, unoptimized parsing or serialization. These show up as high CPU utilization correlating with latency spikes under load.
- I/O-bound issues: Slow database queries, unindexed tables, sequential disk reads, synchronous file operations. The request is waiting, not working.
- Concurrency problems: Thread contention, lock contention, connection pool exhaustion. Look for requests queuing behind each other even when CPU is idle.
- Memory pressure: Garbage collection pauses (especially in JVM or .NET apps), memory leaks causing gradual degradation over time, excessive object allocation in hot paths.
- Data volume issues: Queries returning far more rows than needed, missing pagination, large payloads being serialized and sent in full when only a subset is required.
- External dependency latency: Third-party APIs, payment gateways, or microservice calls without timeouts, retries, or circuit breakers. One slow downstream call can make your entire request slow.
Understanding whether a bottleneck is constant versus spiky matters too. Constant latency suggests a structural issue like a missing index. Spiky latency that correlates with load suggests a concurrency or resource exhaustion problem. This distinction drives different solutions entirely.
Validating hypotheses with production-safe tests
Finding a likely bottleneck is not the same as confirming it. Reproducing slow behavior and confirming root cause with profiling and logs before making changes is what separates engineers who fix things from engineers who change things and hope. Skipping this step is one of the most common and expensive mistakes teams make during a performance testing guide execution.
Here’s a structured approach to hypothesis validation:
- State a specific hypothesis. Example: “The P99 latency spike on the “/orders/search` endpoint is caused by a full table scan due to a missing composite index on (user_id, created_at).”
- Reproduce the behavior in a controlled way. Use a load generator to simulate the conditions under which the issue appears. Confirm you can trigger the slow behavior on demand.
- Capture baseline metrics with OpenTelemetry. Record P50, P95, and P99 latency, error rate, and throughput for the affected path. Commit these as your reference baseline.
- Implement the fix in a canary. Deploy the change to a small percentage of traffic using a canary deployment or feature flag.
- Compare results side by side. Canary deployments with OpenTelemetry let you query Prometheus or your APM for version-tagged latency histograms and compare old versus new behavior on live traffic.
- Expand the rollout only after validation. If the canary shows improvement without regression in error rate or throughput, promote the change.
Here’s what a hypothesis validation comparison might look like:
| Metric | Baseline (before fix) | Canary (after fix) | Change |
|---|---|---|---|
| P95 latency | 1,200ms | 310ms | 74% reduction |
| P99 latency | 4,800ms | 780ms | 84% reduction |
| Error rate | 0.3% | 0.2% | Marginal improvement |
| Throughput (RPS) | 420 | 418 | No regression |
One critical detail: accurate canary analysis depends on using identical metric names and attribute schemas for both versions. If your new instrumentation uses different attribute keys than your baseline, you’re not comparing apples to apples. Instrument at the resource attribute level, not with ad-hoc dashboard filters.
Pro Tip: Run each hypothesis test through at least two or three separate load cycles before drawing conclusions. A single test run can produce noise that looks like a result. Statistical significance requires consistency across multiple iterations, especially when latency changes are small.
Once your canary validates the fix, automate the detection logic. Automated performance regression checks in CI/CD pipelines compare each deployment’s latency percentiles against your stored baseline. If P99 degrades by more than your defined threshold, the build fails. This turns a one-time audit win into a permanent quality gate.
Documenting results and setting up ongoing monitoring
The final phase of any application performance review is proving what changed and making sure it stays changed. Quantify the improvement against your original SLOs. A before-and-after table like the canary comparison above belongs in your audit report, not just in a Slack thread.
| SLO target | Before audit | After audit | Status |
|---|---|---|---|
| P95 latency < 400ms | 1,200ms | 310ms | Met |
| P99 latency < 1,000ms | 4,800ms | 780ms | Met |
| Error rate < 0.5% | 0.3% | 0.2% | Met |
| Availability > 99.9% | 99.6% | 99.92% | Met |
Documentation should include: the original hypothesis, the profiling evidence that confirmed root cause, the fix applied, the canary results, and the new baseline metrics. This record serves the next engineer who touches this service and the next audit cycle. Without it, your team is starting from scratch every time.
Set up ongoing monitoring application health with error budget policies. When error budget consumption crosses a defined threshold, the policy triggers a reliability review before new features ship. Cross-signal correlation using combined traces, logs, and metrics keeps your monitoring from being a collection of disconnected dashboards and turns it into an actual diagnostic system.
Pro Tip: Use your error budget as the decision framework for “should we optimize or ship?” If you have budget to spare, ship features. If you’re burning budget fast, optimize. This removes the subjective argument from the conversation entirely.
My honest take on what actually works
I’ve reviewed application performance audits across fintech products, e-commerce platforms, and SaaS tools, and the pattern is consistent. Teams that skip hypothesis validation waste the most engineering time. They see a slow query, rewrite it, deploy it, and declare victory without measuring whether P99 actually moved. Sometimes it didn’t. Sometimes it moved the wrong number.
The other mistake I see constantly is optimizing averages. P50 latency improvements that don’t touch P99 are often invisible to users, because the users who churn are almost always in that tail. Ignoring tail percentiles is how teams spend three sprints on performance work and still get complaints.
What I’ve found actually works is treating the audit like a scientific experiment. You state a hypothesis, gather evidence, test it in a controlled way, measure the outcome, and document what you learned. It sounds obvious, but most teams skip two or three of those steps and then wonder why performance doesn’t improve durably.
The error budget framework is the most underused tool in the conversation about improving application speed. It gives you a data-driven way to stop the endless debate between engineering and product about when to fix reliability versus when to ship. If your budget says “optimize,” you optimize. That clarity alone is worth the audit setup effort.
— Testvox
How Testvox can support your performance audit
Running a thorough application performance audit takes structured methodology, the right tooling, and experience reading what the data actually means. Testvox specializes in exactly this kind of work for startups and SMEs.
Testvox’s performance testing case studies show how structured audits translate into measurable improvements for real products in fintech and e-commerce. If you’re building in fintech specifically, Testvox’s breakdown of performance testing costs and timelines gives you a clear picture of what a professional engagement looks like and what ROI to expect. Whether you need a one-time deep-dive audit before a beta release or ongoing QA partnership, Testvox brings the methodology, tooling, and domain expertise to get it done right.
FAQ
What is an application performance audit?
An application performance audit is a structured, evidence-based process for identifying and resolving bottlenecks that degrade application speed, reliability, and user experience. It covers baseline capture, critical path analysis, hypothesis validation, and post-fix measurement.
How often should you audit application performance?
Most teams benefit from a formal audit at least once per quarter, with continuous monitoring and automated regression checks in CI/CD pipelines handling the ongoing detection between cycles.
Why use P95 and P99 instead of average latency?
Average latency masks the worst-case experiences that drive user churn. P95 and P99 percentiles show exactly what the slowest users encounter, making them the correct metrics for diagnosing real-world performance problems.
What tools are needed for a performance audit?
A production performance audit typically requires a distributed tracing tool (OpenTelemetry is the standard), a metrics store like Prometheus, a load generator, access to application logs, and an APM platform for cross-signal correlation.
How do canary deployments help validate performance fixes?
Canary deployments route a small percentage of live traffic to a new version, letting you compare latency histograms side by side against the baseline. This confirms whether a fix works in production before full rollout.
Recommended
- A Practical Guide for Performance Testing in Agile Times
- Fintech Performance Testing Cost, Timeline & ROI
- Mobile App Testing–Best Practices and challenges.
- How to Prepare Your App for Launch: A 13-Point Checklist…
27 August 2024


ABOUT TESTVOX

Testvox is a software testing company help your product reach its full potential. Get full cycle testing for your mobile and web applications while ensuring all quality assurance standards are met... Read More
100+
Applications
Assured
Assured

5 Star Rating

5 Star Rating
“By participating in our release lifecycle, Testvox's standard QA process has helped us to launch quality products faster.”

Rima Hudaifa
Manager | Cadvil
Manager | Cadvil
