
 24 August 2026

Find Your Slow Tests: A Deep Dive into Playwright’s Speedboard Timeline
25 August 2026
 9 min 42 sec
  BY
Harshit Gupta
BY
Harshit Gupta
A logistics SaaS client we work with had a number they’d stopped looking at. Their Playwright suite took 18 minutes on CI, and everyone had quietly made peace with it — you kicked off the pipeline, went for coffee, came back, maybe it was green. The suite wasn’t flaky. Nobody was firefighting. It was just slow, in the low-grade way that never makes it onto a sprint board because no single person owns it — meanwhile the dispatchers and operations staff who live in the app waited on releases that crawled through the pipeline.
Here’s the payoff up front: the Playwright Speedboard is a free tab in the HTML report that ranks your slow tests slowest-first, so you stop guessing at test performance and start fixing the handful of tests that own your CI clock. So one afternoon we asked the obvious question nobody had asked out loud — which tests are actually eating the 18 minutes? We opened the HTML report, clicked a tab most of the team had never noticed, and there it was.
Four tests — out of roughly three hundred — were responsible for more than half the wall-clock time. One of them, a “dispatch a multi-stop delivery route” flow, took over three minutes on its own. It logged in from scratch, seeded a batch of orders through the real API, and waited on a routing sandbox that was slow by nature. Nobody had decided that test should gate every deploy. It just grew that way, one reasonable-looking await at a time.
That tab is Playwright’s Speedboard, and if you run a suite of any size and haven’t looked at it yet, it’s the highest-leverage ten minutes you’ll spend this quarter. Below we walk through what it is, how to find your slow Playwright tests with it, how to read the timeline view, and how it compares to profiling by hand.
What is the Playwright Speedboard?
Let’s get the naming right, because there’s a lot of loose talk online.
Speedboard is a tab in Playwright’s built-in HTML reporter. It landed in v1.57 (late November 2025). The official release notes describe it exactly: “In HTML reporter, there’s a new tab we call ‘Speedboard’: It shows you all your executed tests sorted by slowness, and can help you understand where your test suite is taking longer than expected.” That’s the whole idea — your tests, ranked slowest-first, on a page you already generate.
It is not a separate tool, a paid dashboard, or a performance-testing product. You don’t install anything. If you already run npx playwright test –reporter=html (or have html in your reporter config), you already have it. Open the report, click Speedboard, done.
Speedboard vs the Timeline view
The next release, v1.58 (January 2026), added the piece that gives this post its title. Per the release notes for that version: “If you’re using merged reports, the HTML report Speedboard tab now shows the Timeline.” That “merged reports” clause matters, and we’ll come back to it — the timeline view is specifically useful once you’re sharding across machines, which is exactly when your slow tests get hardest to see.
So: Speedboard is the ranked list. The Timeline is the sharded, wall-clock view layered on top. Two features, one tab, both aimed at the same question — where is the time going?
How do you find slow Playwright tests?
Hunt the tail, not the average
Here’s the mental model that changes how you read it. A slow suite is almost never uniformly slow. It’s a few fat tests dragging a long tail of quick ones. That’s a Pareto distribution, and Speedboard is a Pareto chart wearing a table’s clothes.
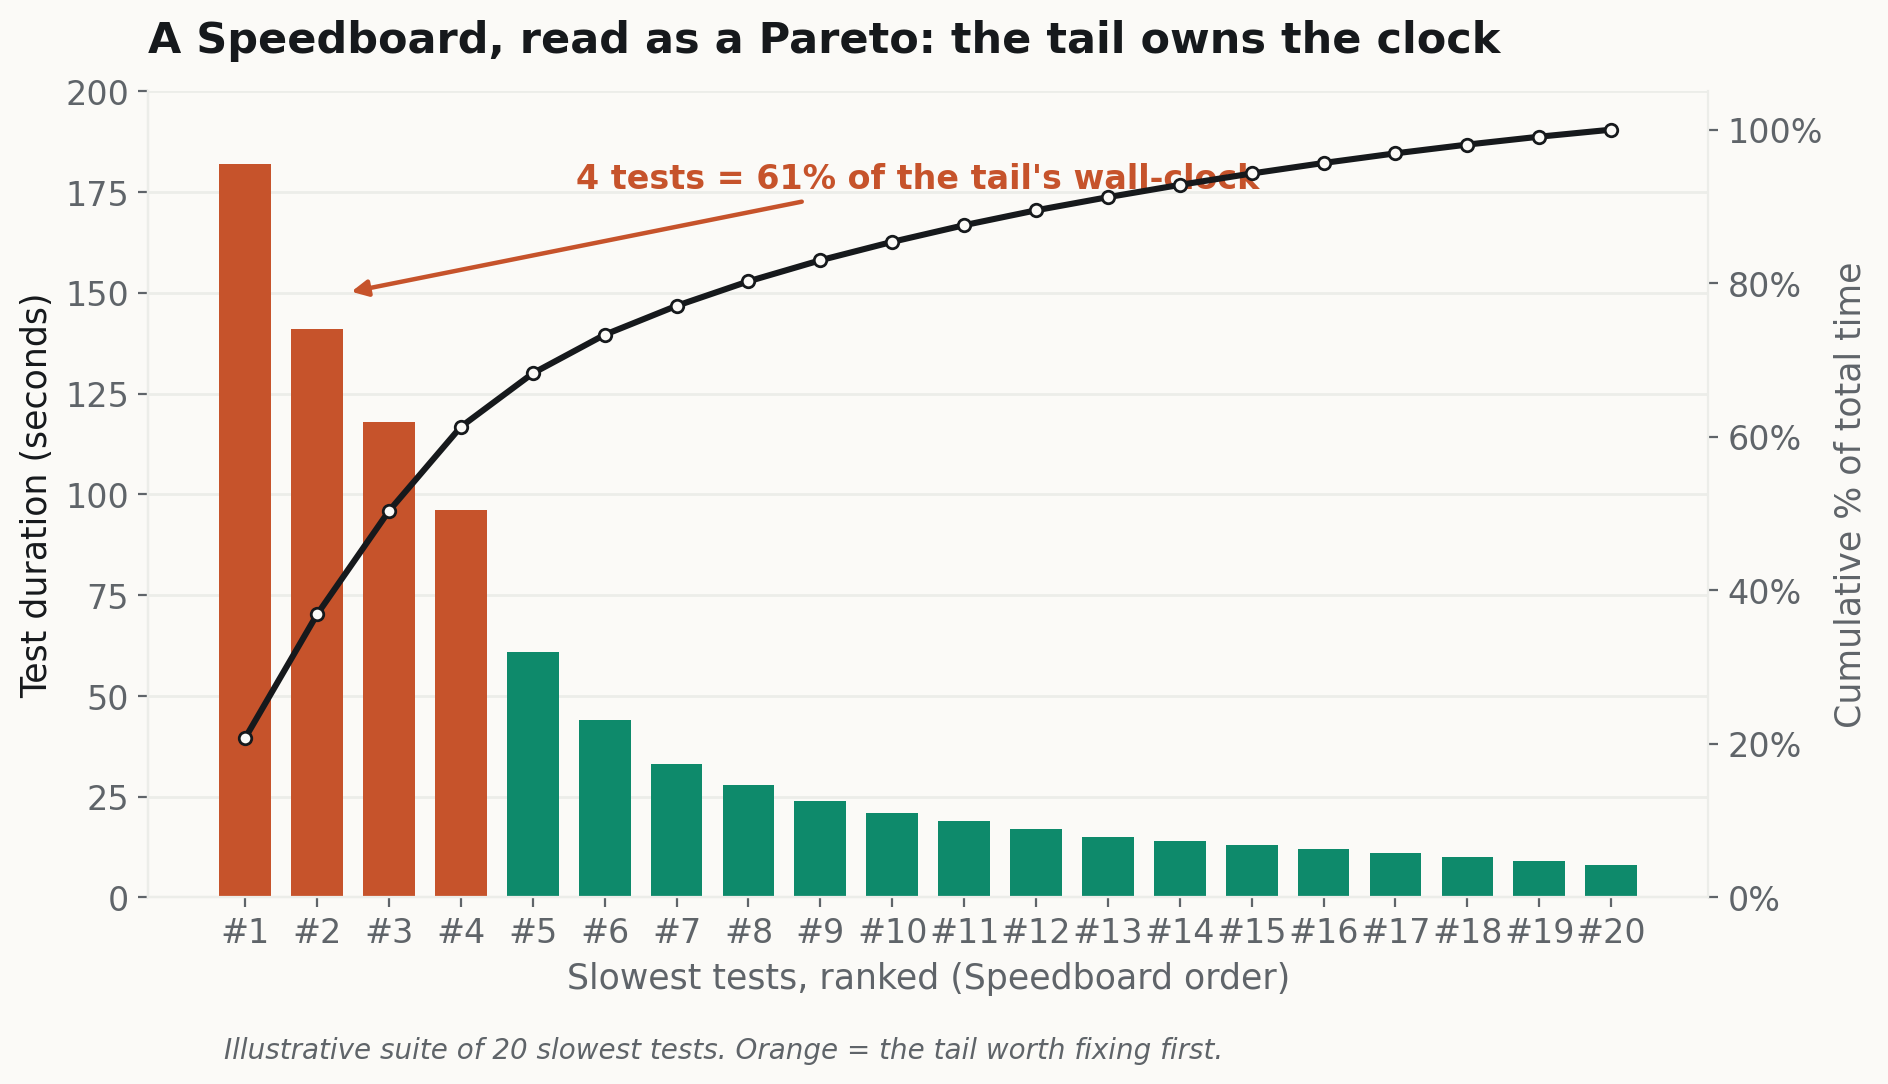
Read your Speedboard top-down and stop early. The first handful of rows is where nearly all your time — and nearly all your leverage — lives.
When you open it, resist the urge to scroll. The answer is at the top. In practically every suite we’ve profiled, the top three to five tests own an outsized share of the total. Fix those and you’ve bought back most of your CI time; optimise test #47 and you’ve saved nobody anything.
What makes a Playwright test slow?
What you’re looking for in those top rows is why they’re slow, and it usually falls into a small set of culprits. A 2026 practitioner deep-dive from TestDino catalogues the usual suspects well: hardcoded waits (a single page.waitForTimeout(2500) burns two and a half seconds every run, guaranteed), logging in through the UI on every test (four seconds each, times a hundred tests, is over six minutes of pure ceremony), real API calls where a stubbed one would do, and over-broad selectors that make the engine work harder than it should.
Their rule of thumb is worth stealing: an end-to-end test that runs past four to five minutes has usually stopped being a test and started being a liability. The Speedboard won’t tell you which of those is biting — it tells you which test to open next. That’s the point. It turns “our suite is slow” (unactionable, demoralising) into “these four tests are slow, and here’s the order to fix them in” (a to-do list).
How do you read the Speedboard timeline?
Now the harder problem, and the reason the v1.58 Timeline exists.
The moment you split your suite across machines to go faster — sharding — you lose the plot on where time goes. Each shard reports its own duration. You add them up wrong, or you look at the longest shard, and you can’t see the picture.
Playwright’s sharding is dead simple to turn on: pass –shard=1/4, –shard=2/4 and so on to four parallel CI jobs, then stitch the results back together with a blob reporter and npx playwright merge-reports –reporter html ./all-blob-reports. The docs also note that with fullyParallel: true Playwright splits work at the individual-test level rather than the file level, so your shards come out more evenly balanced.
The timeline view renders that merged run as wall-clock lanes — you see each worker as a track and each test as a block along it. Suddenly the gaps are visible: the shard that finished in four minutes while the others took nine, the one test that started late and held everything open, the setup that serialised when you thought it was parallel. It’s the difference between a spreadsheet of durations and a picture of what your CI actually did with its afternoon.
Why sharding alone can’t beat your slowest test
And it exposes a truth that pure sharding hides.
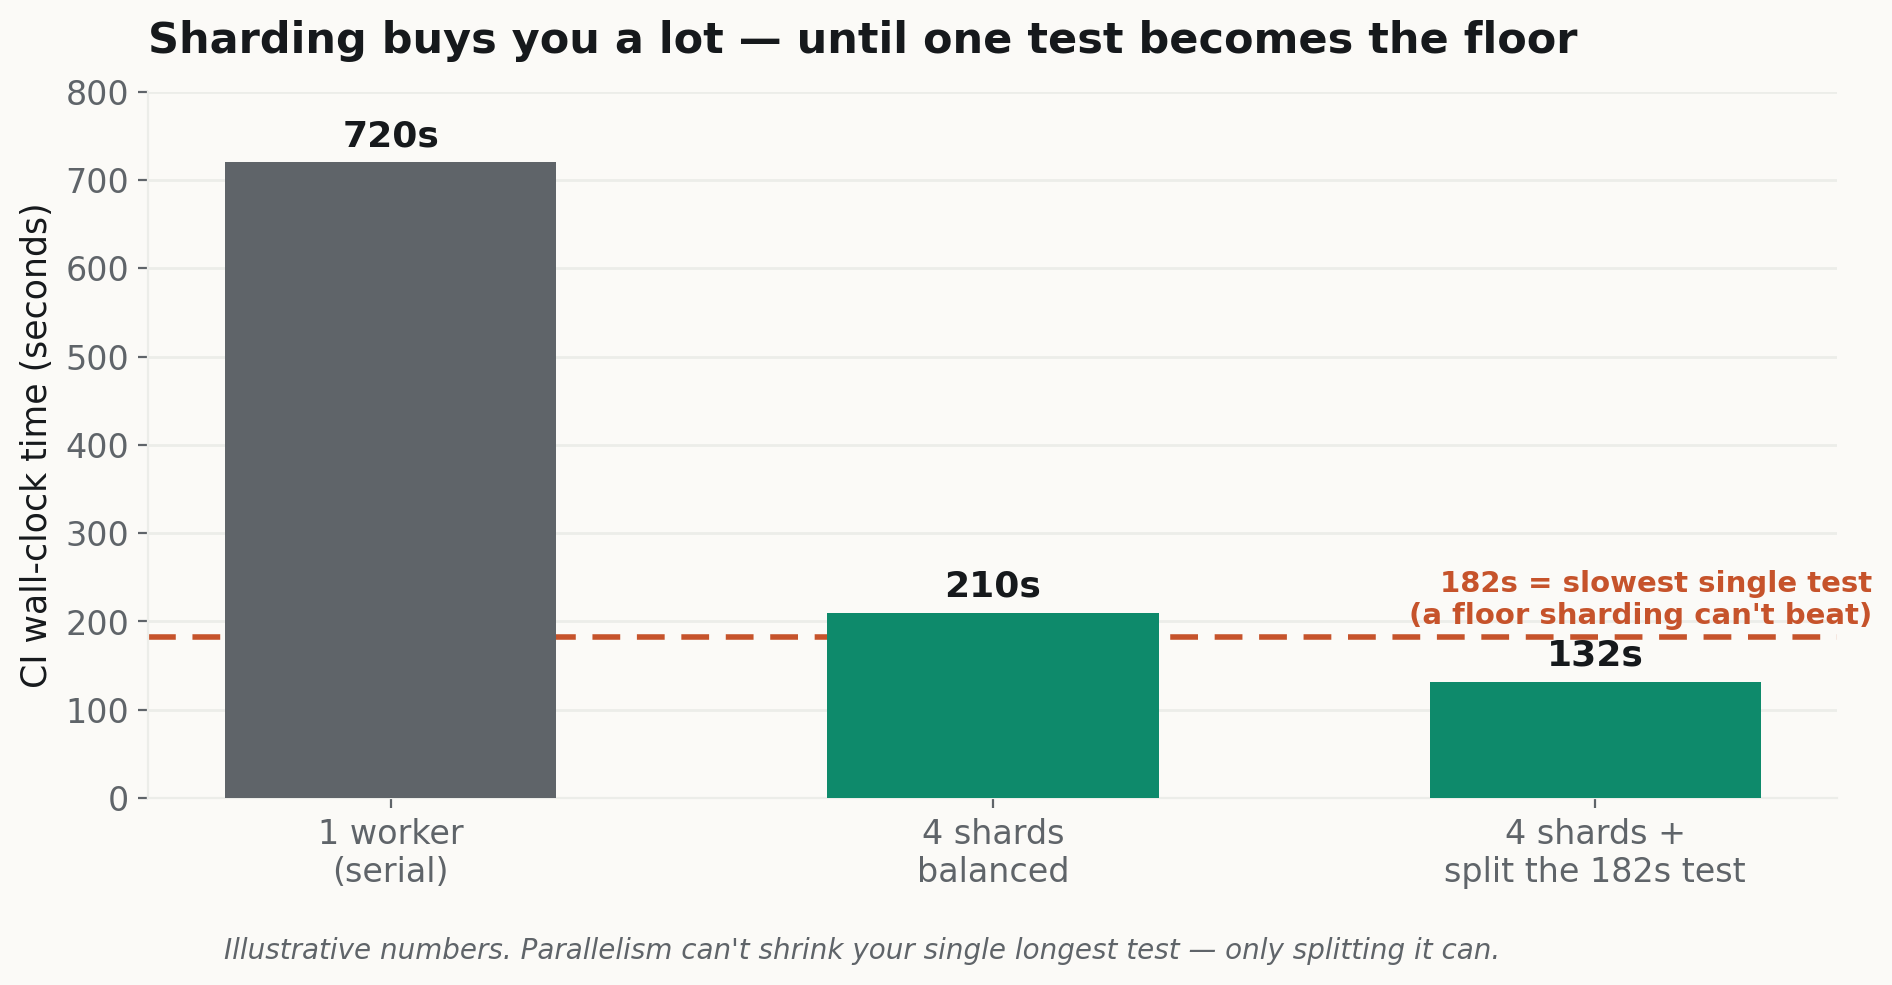
Parallelism divides the work, but it can’t divide a single test. Your longest individual test is a floor no amount of sharding gets you under.
This is the bit teams miss. You can throw eight shards at a suite and the total run will never drop below your single slowest test, because that test runs on one worker, start to finish, no matter how many machines you rent. If your Speedboard says one test takes three minutes, three minutes is your floor.
The Timeline makes that floor visible as a lonely long block while everything else has finished. The only fix is to make the test itself shorter — or split it into smaller tests that can land on different workers. Which is why we always look at Speedboard before reaching for more parallelism. Buying more CI runners to work around a fixable three-minute test is paying rent to avoid a repair.
Speedboard vs manual test profiling
Before Speedboard, finding your slow tests meant profiling by hand — wrapping tests in custom timers, or exporting the JSON reporter and sorting durations in a spreadsheet. Both work. Neither is fun, and neither survives a sharded run gracefully. Here’s how the two approaches stack up.
| Dimension | Speedboard timeline | Manual profiling (custom timers / raw reporter output) |
| Setup effort | None — a tab in the HTML report you already generate (v1.57+) | Wrap tests in timers, or parse the JSON reporter output yourself |
| Sorting slowest-first | Automatic, built in | You sort the durations by hand |
| What you see | Every executed test ranked by slowness on one page | Whatever your timers or reporter emit — raw durations, not a ranked picture |
| Sharded / cross-machine view | Timeline shows merged, sharded runs as per-worker wall-clock lanes (v1.58) | You stitch each shard’s numbers together manually |
| Accuracy | Uses Playwright’s own recorded test durations | As accurate as the timers you write — easy to measure the wrong span |
| Maintenance | Ships and updates with Playwright | Custom scripts you own and keep working |
Our verdict: for finding slow tests in 2026, the Speedboard wins outright — it’s zero-setup, always current, and the only one of the two that hands you a wall-clock timeline across sharded workers. We still keep the JSON reporter around for one job: feeding durations into a trend dashboard so we can watch test performance drift over weeks. Use manual profiling for long-term tracking; use the Speedboard for the daily question of which test to open next.
How do you fix slow Playwright tests?
Once Speedboard has named your top offenders, the moves are well-worn and, honestly, mostly boring. Boring is good. Here’s the order we’d do them in.
- Kill the hard waits first. Search your top tests for waitForTimeout. Nearly every one is a bug in waiting — replace it with a web-first assertion like await expect(locator).toBeVisible(), which waits for the actual condition and returns the instant it’s true instead of burning a fixed number of seconds. This is the cheapest win and it doubles as a flakiness fix.
- Stop logging in through the UI. If your fat tests each sign in via the login form, reuse authentication with Playwright’s storageState — log in once in a setup project, save the cookies and local storage, and inject them into every test. On a suite that logs in a hundred times, this alone can claw back minutes.
- Turn on real parallelism. Set fullyParallel: true and let Playwright run several worker processes at once. Confirm your tests are actually independent first — parallelism punishes hidden shared state — but once they are, this is close to free speed.
- Shard across CI machines. For big suites, –shard=x/y plus merge-reports spreads the load, and the merged report is exactly what feeds the Timeline. Do this after the first three, not instead of them.
- Tag and split. Tag your genuinely slow, low-churn tests (@slow, @nightly) so a fast smoke run gates every pull request while the heavy stuff runs on a schedule. And if one test is a three-minute monolith, break it into independent tests that can spread across workers — that’s how you get under the floor from the diagram above.
Notice the sequence. Fix the tests, then parallelise, then shard. Teams that do it backwards end up with a fast-but-still-wasteful suite and a bigger CI bill.
When should you bring in help?
For a tidy suite, this is an afternoon of work and you don’t need anyone. Where it gets thorny is the older, larger suite — the one where the slow tests are slow for structural reasons (shared fixtures, a login you can’t easily cache, tests that were never independent to begin with) and speeding them up means reworking the test automation architecture, not tweaking a config.
That’s the kind of thing we do at Testvox, a software-testing and QA-automation practice: a focused review of a Playwright suite that reads the Speedboard with you, finds the tail that’s costing you, and leaves your team with the conventions to keep it fast — or, if you’d rather not pull your own engineers off the roadmap, an embedded automation engineer to do the rework. Our testing case studies show what that looks like on real suites. But start with the free step: open the tab, read the top five rows, and see how much of your CI time four tests are quietly holding hostage.
Frequently asked questions about the Playwright Speedboard
Is “Speedboard” a real Playwright feature or a plugin?
It’s a real, built-in feature — a tab in Playwright’s HTML reporter, added in v1.57 (November 2025). No install, no third-party service. If you generate an HTML report, it’s already there.
How do you find slow tests with the Playwright Speedboard?
Generate the HTML report (–reporter=html), open it, and click the Speedboard tab. Tests arrive already sorted slowest-first, so read from the top: the three-to-five tests at the top usually own most of your CI time. Open those, not the long tail.
What’s the difference between the Speedboard and the timeline view?
Speedboard is the list of your tests ranked slowest-first. The Timeline, added in v1.58 for merged reports, shows that same run as wall-clock lanes across your sharded workers — so you can see gaps, stragglers, and serialisation, not just per-test durations.
Do you need to shard your tests to use Speedboard?
No. The ranked Speedboard list works on any HTML report from a single run. The timeline view specifically activates when you’re using merged reports from a sharded run.
Is the Playwright Speedboard free?
Yes. It ships inside Playwright’s built-in HTML reporter — there’s no license, subscription, or third-party dashboard to buy. If you’re on v1.57 or later, you already have it.
Will sharding fix my slow suite on its own?
Only up to a point. Sharding divides work across machines, but no shard can run faster than your single slowest test — that test is a hard floor. Fix or split the fat tests first, then shard.
How slow is “too slow” for one test?
There’s no official number, but a common practitioner rule is that end-to-end tests should finish inside two to three minutes, and anything past four to five minutes has usually become brittle and worth splitting. Treat your Speedboard’s top rows as the shortlist.
Key takeaways
- The Playwright Speedboard ranks your slow tests slowest-first in the built-in HTML reporter (v1.57+) — zero install, and the fastest way to see where test performance is leaking.
- Hunt the tail, not the average. In most suites the top three-to-five tests own the majority of CI time; fix those and skip test #47.
- The timeline view (v1.58) exposes the sharding floor. No amount of parallelism runs faster than your single slowest test — shorten it or split it across workers.
- Fix, then parallelise, then shard. Kill hard waits, cache auth with storageState, turn on fullyParallel, then shard — in that order, not backwards.
- Speedboard beats manual profiling for the daily question of which test to open next; keep the JSON reporter only for long-term trend dashboards.
Want a second pair of eyes on a Playwright suite that’s quietly costing you? Talk to the Testvox team — we’ll read the Speedboard with you, name the tail that’s eating your CI time, and leave your team with the conventions to keep it fast.
24 August 2026

 25 April 2026

AI Test Architect & Lead SDET with 11+ years of expertise in Playwright, API testing, automation, and AI/LLM evaluation. He focuses on delivering high-quality, user-centric software through AI-assisted testing, efficient testing strategies, and continuous innovation. Connect with him on
ABOUT TESTVOX

Testvox is a software testing company help your product reach its full potential. Get full cycle testing for your mobile and web applications while ensuring all quality assurance standards are met... Read More
100+
Applications
Assured
Assured

5 Star Rating

5 Star Rating
“By participating in our release lifecycle, Testvox's standard QA process has helped us to launch quality products faster.”

Rima Hudaifa
Manager | Cadvil
Manager | Cadvil
